Toy data generation
This notebook generates the toy data used in the following examples. It’s not necessary to run this notebook as the toy data generation will be executed in the background if needed. This notebook illustrates the properties of the toy dataset.
[1]:
import numpy as np
import pandas as pd
import seaborn as sns
import matplotlib.pyplot as plt
from pylorentz import Momentum4

from freeforestml import Variable, Process, Cut, hist, McStack
from freeforestml.toydata import generate, proposal, mcmc_step, vbfh_pdf, mcmc, ztt_pdf
2023-08-02 16:40:26.630387: I tensorflow/core/platform/cpu_feature_guard.cc:193] This TensorFlow binary is optimized with oneAPI Deep Neural Network Library (oneDNN) to use the following CPU instructions in performance-critical operations:  AVX2 AVX512F FMA
To enable them in other operations, rebuild TensorFlow with the appropriate compiler flags.
2023-08-02 16:40:26.763238: W tensorflow/compiler/xla/stream_executor/platform/default/dso_loader.cc:64] Could not load dynamic library 'libcudart.so.11.0'; dlerror: libcudart.so.11.0: cannot open shared object file: No such file or directory
2023-08-02 16:40:26.763269: I tensorflow/compiler/xla/stream_executor/cuda/cudart_stub.cc:29] Ignore above cudart dlerror if you do not have a GPU set up on your machine.
2023-08-02 16:40:27.588357: W tensorflow/compiler/xla/stream_executor/platform/default/dso_loader.cc:64] Could not load dynamic library 'libnvinfer.so.7'; dlerror: libnvinfer.so.7: cannot open shared object file: No such file or directory
2023-08-02 16:40:27.588457: W tensorflow/compiler/xla/stream_executor/platform/default/dso_loader.cc:64] Could not load dynamic library 'libnvinfer_plugin.so.7'; dlerror: libnvinfer_plugin.so.7: cannot open shared object file: No such file or directory
2023-08-02 16:40:27.588469: W tensorflow/compiler/tf2tensorrt/utils/py_utils.cc:38] TF-TRT Warning: Cannot dlopen some TensorRT libraries. If you would like to use Nvidia GPU with TensorRT, please make sure the missing libraries mentioned above are installed properly.
[2]:
# shuffle=False allows plotting the MC walk
%time df = generate(10000, vbfh_frac=0.5, shuffle=False)
CPU times: user 39.6 s, sys: 137 ms, total: 39.7 s
Wall time: 39.6 s
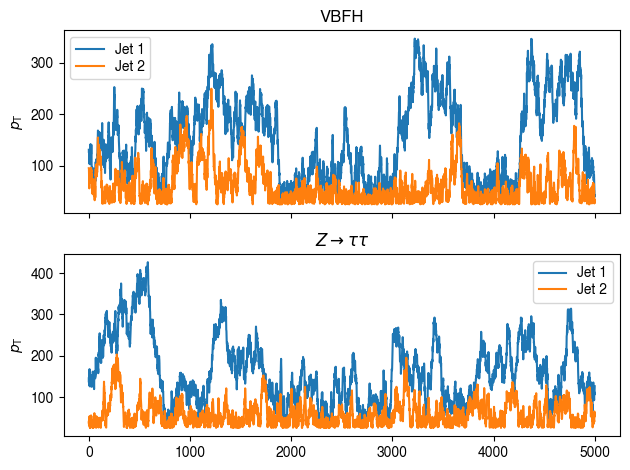
Markov chain walk
[3]:
idx = df.fpid == 1
fig, ax = plt.subplots(2, 1, sharex=True)
ax[0].set_title("VBFH")
ax[0].plot(np.arange(sum(idx)), df.jet_1_pt[idx], label="Jet 1")
ax[0].plot(np.arange(sum(idx)), df.jet_2_pt[idx], label="Jet 2")
ax[0].set_ylabel(r"$p_{\mathrm{T}}$")
ax[0].legend()

ax[1].set_title(r"$Z\rightarrow\tau\tau$")
ax[1].plot(np.arange(sum(~idx)), df.jet_1_pt[~idx], label="Jet 1")
ax[1].plot(np.arange(sum(~idx)), df.jet_2_pt[~idx], label="Jet 2")
ax[1].set_ylabel(r"$p_{\mathrm{T}}$")
ax[1].legend()
fig.tight_layout()
None
[4]:
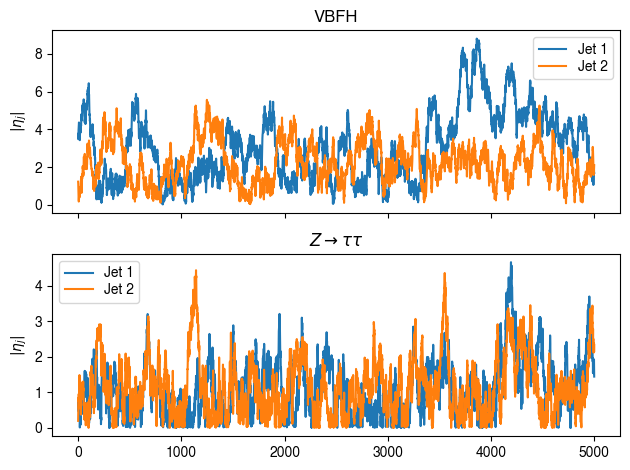
fig, ax = plt.subplots(2, 1, sharex=True)
ax[0].set_title("VBFH")
ax[0].plot(np.arange(sum(idx)), df.jet_1_eta[idx].abs(), label="Jet 1")
ax[0].plot(np.arange(sum(idx)), df.jet_2_eta[idx].abs(), label="Jet 2")
ax[0].set_ylabel(r"$|\eta_j|$")
ax[0].legend()

ax[1].set_title(r"$Z\rightarrow\tau\tau$")
ax[1].plot(np.arange(sum(~idx)), df.jet_1_eta[~idx].abs(), label="Jet 1")
ax[1].plot(np.arange(sum(~idx)), df.jet_2_eta[~idx].abs(), label="Jet 2")
ax[1].set_ylabel(r"$|\eta_j|$")
ax[1].legend()
fig.tight_layout()
None
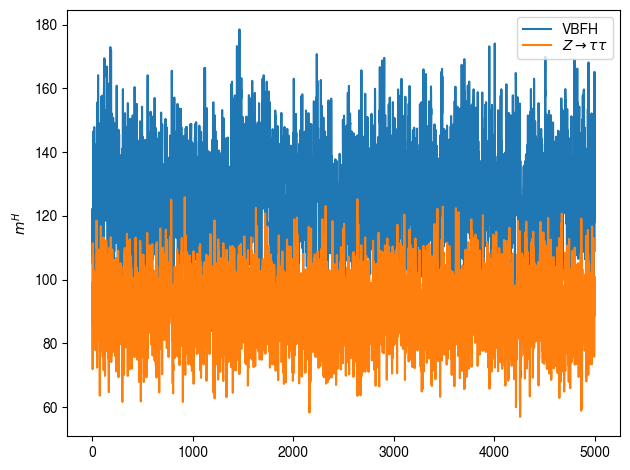
[5]:
fig, ax = plt.subplots(1, 1)
ax.plot(np.arange(sum(idx)), df.higgs_m[idx], label="VBFH")
ax.plot(np.arange(sum(~idx)), df.higgs_m[~idx], label=r"$Z\rightarrow\tau\tau$")
ax.set_ylabel(r"$m^H$")
ax.legend()
fig.tight_layout()
None
Toy data distributions
[6]:
p_vbfh = Process("VBFH", range=(1, 1))
p_ztt = Process(r"$Z\rightarrow\tau\tau$", range=(0, 0))
s_all = McStack(p_vbfh, p_ztt)
[7]:
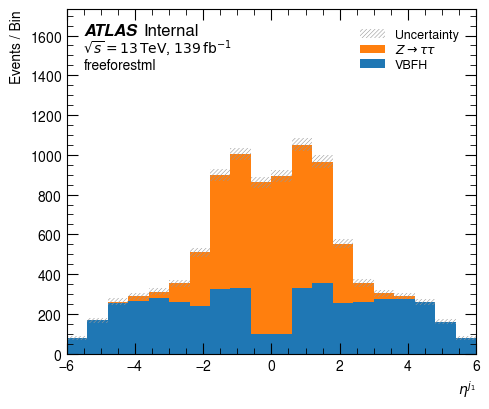
jet_1_eta = Variable(r"$\eta^{j_1}$", "jet_1_eta")
[8]:
hist(df, jet_1_eta, bins=20, range=(-6, 6), stacks=[s_all], weight="weight")
None
[9]:
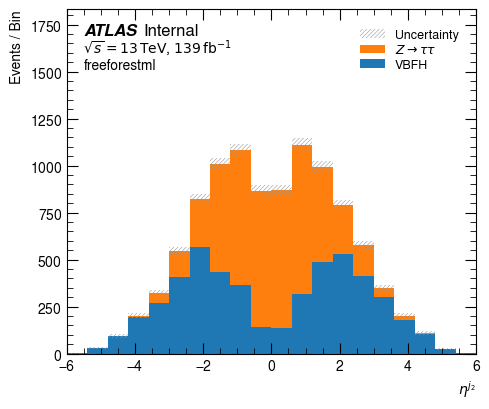
jet_2_eta = Variable(r"$\eta^{j_2}$", "jet_2_eta")
hist(df, jet_2_eta, bins=20, range=(-6, 6), stacks=[s_all], weight="weight")
None
[10]:
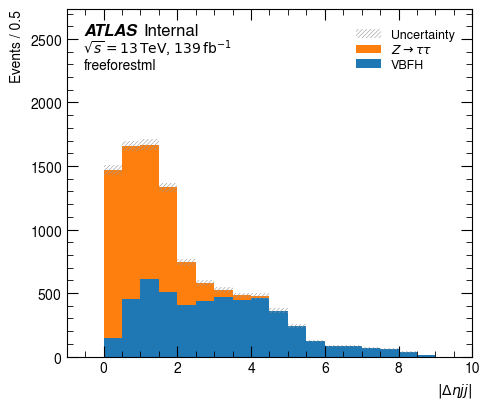
delta_eta_jets = Variable(r"$|\Delta\eta{jj}|$", lambda d: d.jet_1_eta.abs())
hist(df, delta_eta_jets, bins=22, range=(-1, 10), stacks=[s_all], weight="weight")
None
[11]:
jet_1_pt = Variable(r"$p_{\mathrm{T}}^{j_1}$", "jet_1_pt")
jet_2_pt = Variable(r"$p_{\mathrm{T}}^{j_2}$", "jet_2_pt")
hist(df, jet_1_pt, bins=50, range=(0, 1000), stacks=[s_all], weight="weight")
hist(df, jet_2_pt, bins=25, range=(0, 250), stacks=[s_all], weight="weight")
None
[12]:
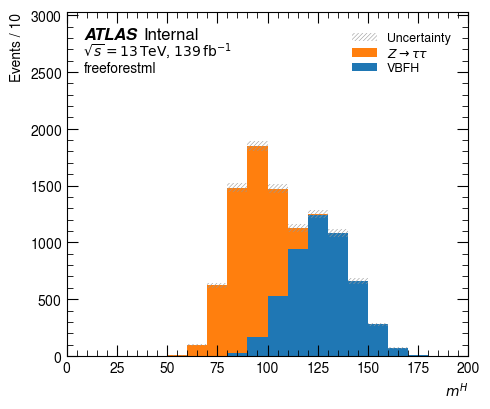
v_higgs_m = Variable(r"$m^H$", "higgs_m")
hist(df, v_higgs_m, bins=20, range=(0, 200), stacks=[s_all], weight="weight")
None
[13]:
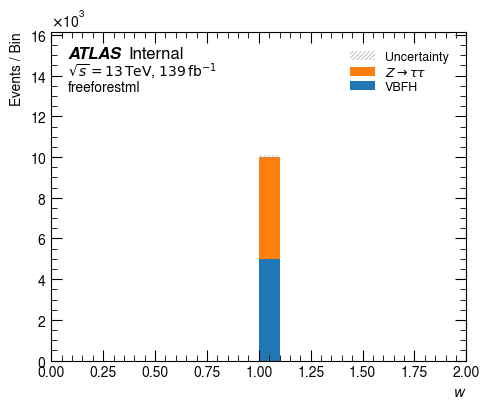
v_weight = Variable(r"$w$", "weight")
hist(df, v_weight, bins=20, range=(0, 2), stacks=[s_all],
     weight=lambda d: d.weight * 1 + 0)
None
[14]:
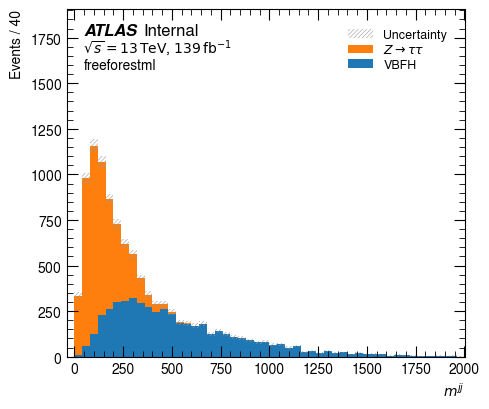
v_mjj = Variable(r"$m^{jj}$", "m_jj")
hist(df, v_mjj, bins=51, range=(-40, 2000), stacks=[s_all], weight="weight")
hist(df, v_mjj, bins=51, range=(-40, 2000), stacks=[s_all], weight="weight")
None

[15]:
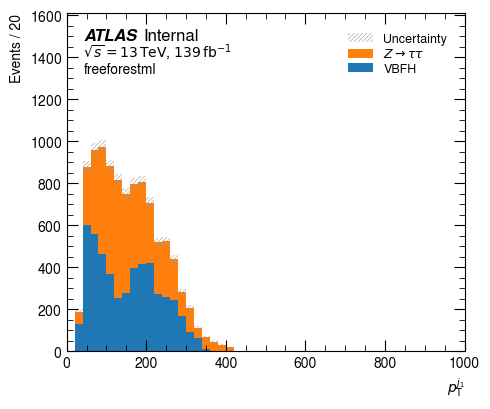
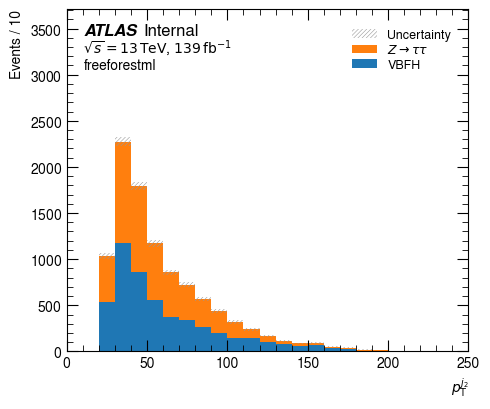
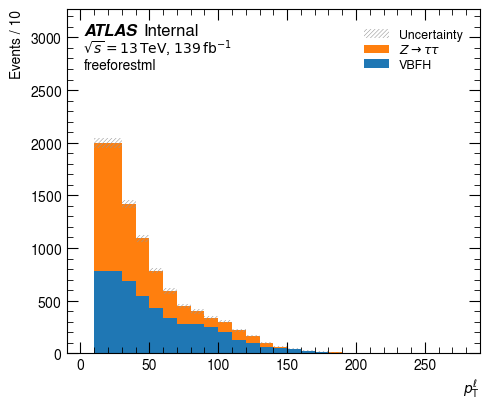
v_lep_pt = Variable(r"$p^{\ell}_{\mathrm{T}}$", "lep_pt")
hist(df, v_lep_pt, bins=30, range=(-10, 290), stacks=[s_all], weight="weight")
None
[16]:
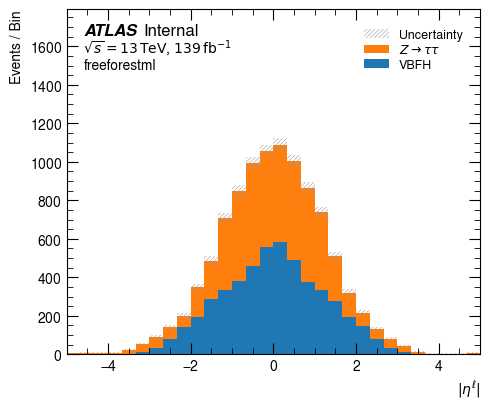
v_lep_eta = Variable(r"$|\eta^{\ell}|$", "lep_eta")
hist(df, v_lep_eta, bins=30, range=(-5, 5), stacks=[s_all], weight="weight")
None
[17]:
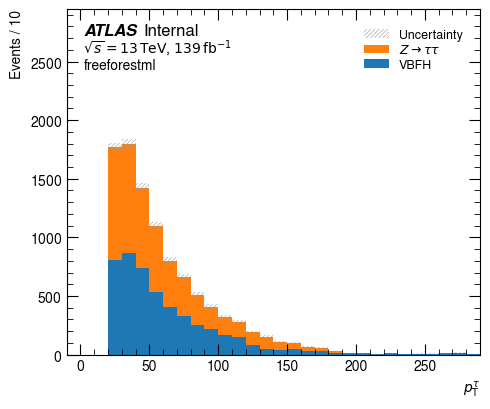
v_tau_pt = Variable(r"$p^{\tau}_{\mathrm{T}}$", "tau_pt")
hist(df, v_tau_pt, bins=30, range=(-10, 290), stacks=[s_all], weight="weight")
None
[18]:
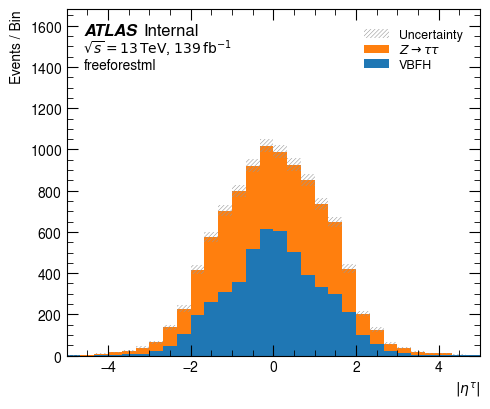
v_tau_eta = Variable(r"$|\eta^{\tau}|$", "tau_eta")
hist(df, v_tau_eta, bins=30, range=(-5, 5), stacks=[s_all], weight="weight")
None
[19]:
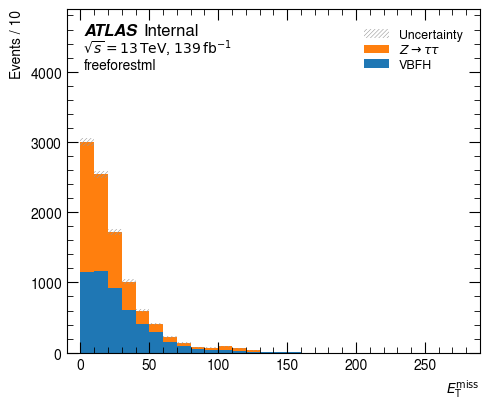
v_met_pt = Variable(r"$E^{\mathrm{miss}}_{\mathrm{T}}$", "met_pt")
hist(df, v_met_pt, bins=30, range=(-10, 290), stacks=[s_all], weight="weight")
None
[20]:
v_lep_cent = Variable(r"$\eta^{\ell}$", "tau_centrality")
hist(df, v_lep_cent, bins=22, range=(-0.05, 1.05), stacks=[s_all], weight="weight")
None
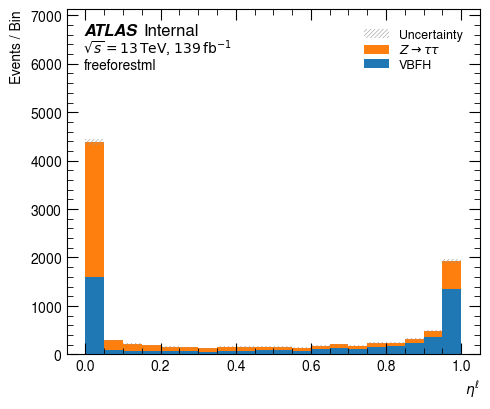
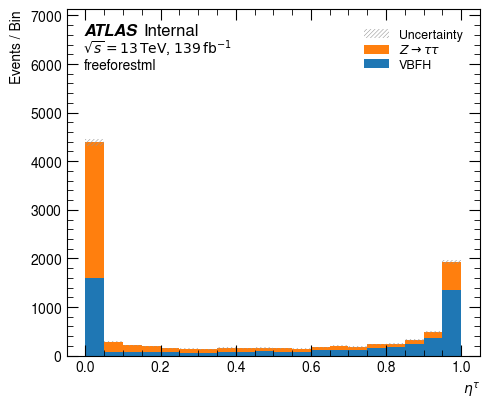
[21]:
v_tau_cent = Variable(r"$\eta^{\tau}$", "tau_centrality")
hist(df, v_tau_cent, bins=22, range=(-0.05, 1.05), stacks=[s_all], weight="weight")
None