Histograms
This notebook shows how to generate histograms with various settings.
[1]:
import pandas as pd
import seaborn as sns

from freeforestml import Variable, Process, Cut, hist, McStack, DataStack, Stack
from freeforestml import toydata, example_style
example_style()
2023-08-02 16:39:22.212654: I tensorflow/core/platform/cpu_feature_guard.cc:193] This TensorFlow binary is optimized with oneAPI Deep Neural Network Library (oneDNN) to use the following CPU instructions in performance-critical operations:  AVX2 AVX512F FMA
To enable them in other operations, rebuild TensorFlow with the appropriate compiler flags.
2023-08-02 16:39:22.347807: W tensorflow/compiler/xla/stream_executor/platform/default/dso_loader.cc:64] Could not load dynamic library 'libcudart.so.11.0'; dlerror: libcudart.so.11.0: cannot open shared object file: No such file or directory
2023-08-02 16:39:22.347836: I tensorflow/compiler/xla/stream_executor/cuda/cudart_stub.cc:29] Ignore above cudart dlerror if you do not have a GPU set up on your machine.
2023-08-02 16:39:23.179132: W tensorflow/compiler/xla/stream_executor/platform/default/dso_loader.cc:64] Could not load dynamic library 'libnvinfer.so.7'; dlerror: libnvinfer.so.7: cannot open shared object file: No such file or directory
2023-08-02 16:39:23.179231: W tensorflow/compiler/xla/stream_executor/platform/default/dso_loader.cc:64] Could not load dynamic library 'libnvinfer_plugin.so.7'; dlerror: libnvinfer_plugin.so.7: cannot open shared object file: No such file or directory
2023-08-02 16:39:23.179242: W tensorflow/compiler/tf2tensorrt/utils/py_utils.cc:38] TF-TRT Warning: Cannot dlopen some TensorRT libraries. If you would like to use Nvidia GPU with TensorRT, please make sure the missing libraries mentioned above are installed properly.
Setup
Load or generate toy dataset.
[2]:
df = toydata.get()
Define processes to plot as deparate colors.
[3]:
p_ztt = Process(r"$Z\rightarrow\tau\tau$", range=(0, 0))
p_sig = Process(r"Signal", range=(1, 1))

p_asimov = Process(r"Asimov", selection=lambda d: d.fpid >= 0)
Define colors and how to stack the processes. Data should not be stacked on top of the MC prediction.
[4]:
colors = ["windows blue", "amber", "greyish", "faded green", "dusty purple"]
palette = sns.xkcd_palette(colors)

s_bkg = McStack(p_ztt, p_sig, palette=palette)
s_data = DataStack(p_asimov)
Define the variable to use on the x-axis.
[5]:
v_higgs_m = Variable(r"$m^H$", "higgs_m", "GeV")
Examples
[6]:
hist(df, v_higgs_m, 20, [s_bkg, s_data], range=(0, 200), selection=None,
     weight="weight",  ratio_label="Data / SM")
None

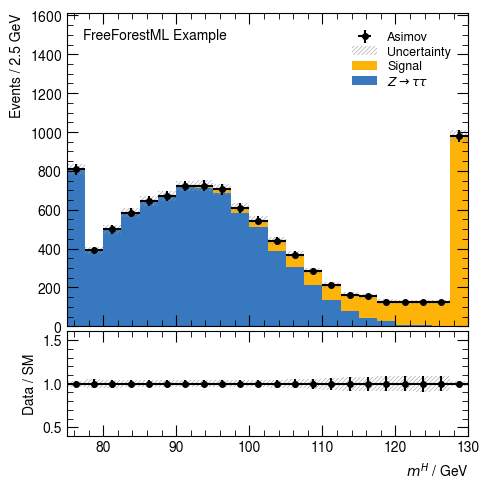
[7]:
hist(df, v_higgs_m, 22, [s_bkg, s_data], range=(75, 130), selection=None,
     weight="weight",  ratio_label="Data / SM", include_outside=True)
None
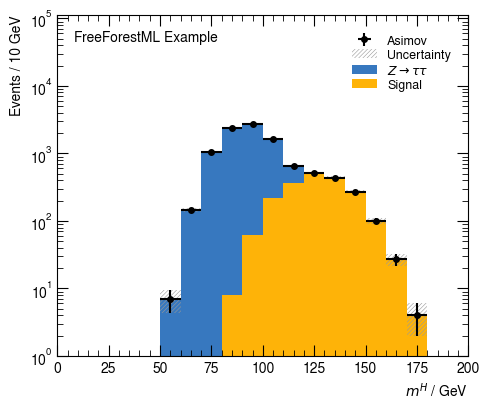
[8]:
hist(df, v_higgs_m, 20, [s_bkg, s_data], range=(0, 200), selection=None,
     weight="weight",  ratio_label="Data / SM", y_log=True, numerator=None)
None
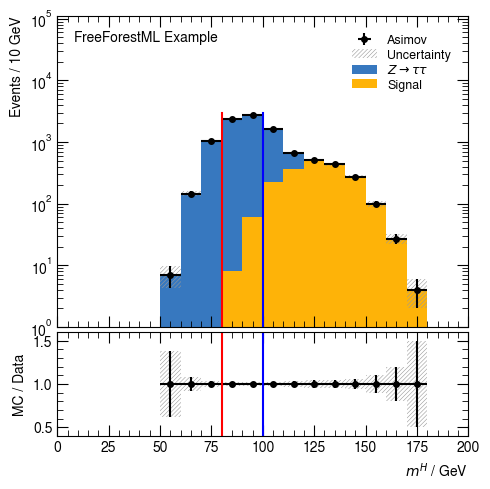
[9]:
hist(df, v_higgs_m, 20, [s_bkg, s_data], range=(0, 200), selection=None,
     weight="weight", ratio_label="MC / Data", y_log=True, y_min=1e-1,
     vlines=[80, {'x': 100, 'color': 'b'}])
None
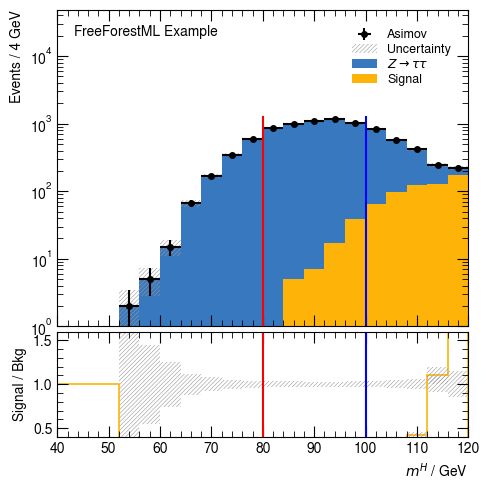
[10]:
s_sig = McStack(p_sig, color=palette[1], histtype='step')
s_ztt = McStack(p_ztt, color=palette[0], histtype='step')

hist(df, v_higgs_m, 20, [s_bkg, s_data], range=(40, 120), selection=None,
     weight="weight", ratio_label="Signal / Bkg", y_log=True, y_min=1e-1,
     vlines=[80, {'x': 100, 'color': 'b'}], numerator=s_sig, denominator=s_ztt)
None
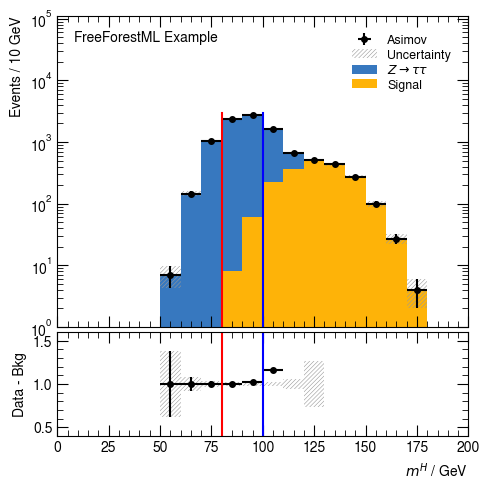
[11]:
hist(df, v_higgs_m, 20, [s_bkg, s_data], range=(0, 200), selection=None,
     weight="weight", ratio_label="Data - Bkg", y_log=True, y_min=1e-1, diff=True,
     enlarge=1.5,
     vlines=[80, {'x': 100, 'color': 'b'}], numerator=s_data, denominator=s_ztt)
None
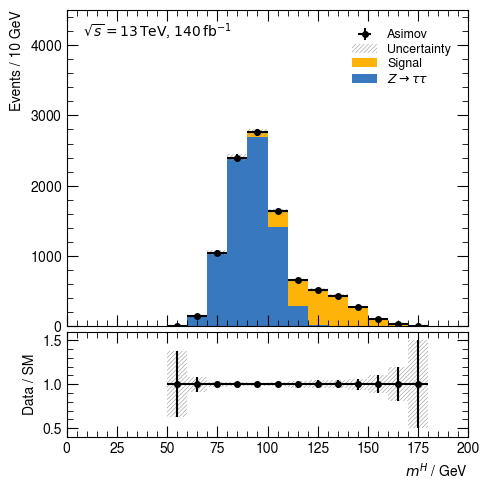
[12]:
import freeforestml.plot as nnp
nnp.INFO = "$\sqrt{s} = 13\,\mathrm{TeV}$, $140\,\mathrm{fb}^{-1}$"
[13]:
hist(df, v_higgs_m, 20, [s_bkg, s_data], range=(0, 200), selection=None,
     weight="weight",  ratio_label="Data / SM")
None
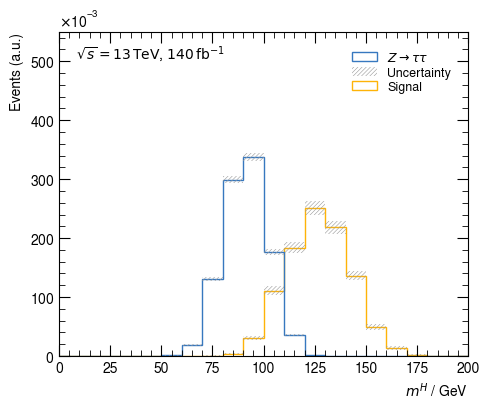
[14]:
s_sig = McStack(p_sig, color=palette[1], histtype='step')
s_ztt = McStack(p_ztt, color=palette[0], histtype='step')

hist(df, v_higgs_m, 20, [s_sig, s_ztt], range=(0, 200), selection=None,
     weight="weight",  numerator=None, density=True)
None
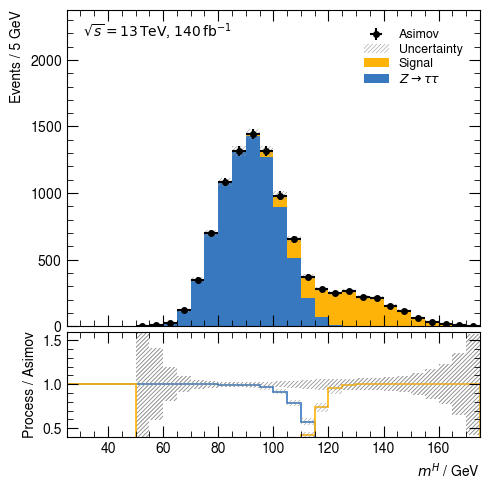
[15]:
hist(df, v_higgs_m, 30, [s_bkg, s_data], range=(25, 175),
     selection=None, numerator=[s_ztt, s_sig], denominator=s_data,
     weight="weight",  ratio_label="Process / Asimov")
None